

Search for advice on a slow connection and nearly every page tells you the same thing: buy more download speed. Move up a tier, double the number on the plan page, and the frozen video call will sort itself out. It won't, and anyone who works from a campground or a farmhouse already knows it.
Download speed is one of four numbers that decide whether a connection works for you. The other three are bandwidth, upload capacity and loaded latency, and the last two are the ones that break remote work while a speed test still shows a healthy result.
Getting the difference straight is what lets you stop guessing. Once you can separate what a connection can carry from how fast one thing arrives, the fixes become obvious: fewer simultaneous tasks, a better antenna position, an upload test at eight in the evening, or a different plan entirely. What follows builds that understanding one step at a time.
Internet Speed vs Bandwidth at a Glance
Here's the version you can hold onto. Internet speed is the rate at which data packets are successfully delivered, usually reported in megabits per second (Mbps). Bandwidth is the maximum amount of information a communications path can carry per unit of time.
The FCC's broadband glossary document spells out the first half: speed is the observed delivery rate, and a 10 Mbps connection can theoretically deliver ten times as much information as a 1 Mbps connection during the same period. Bandwidth describes the potential of the channel rather than what any single task achieves, so a link can carry a great deal of data in total and still hand it to your laptop slowly.
Both get reported in Mbps, which is where the confusion starts. Ookla's global connectivity analysis put the global median fixed-broadband download speed at 93.93 Mbps in June 2024, against 33.5 Mbps for mobile connections. Those are measurements of throughput delivered to real devices, not statements about how much each network could theoretically carry.
Internet speed and bandwidth side by side
| Criterion | Internet speed | Bandwidth |
|---|---|---|
| Core meaning | Rate at which data packets are successfully delivered | Maximum amount of information a path can carry per unit of time |
| Typical unit | Mbps (megabits per second) | Mbps or Gbps as link capacity |
| What it describes | Observed performance at a given moment | Potential carrying capacity of the path |
| Where you see it | Speed test results and plan download and upload tiers | Plan capacity, network links and shared cell or fiber capacity |
| Main limit | Congestion, signal quality and latency | Shared among all devices and users |
| Question it answers | How fast does this file or page arrive? | How many devices and streams can run at once? |
| Fix when weak | Reduce congestion, reposition the router and test loaded latency | Upgrade the tier or reduce simultaneous use |
Two mix-ups cause most of the bad decisions.
- A plan tier is not a measurement. The number on the plan page is a maximum under good conditions, while a speed test shows what reached one device in one minute of one day. Neither one guarantees the other.
- A data cap is not bandwidth. A cap limits the total volume you consume across a billing period. Bandwidth is the rate at which traffic flows right now.
Working rule: check bandwidth to know how many tasks fit at the same time, then check measured speed and latency to know how each of those tasks will actually feel.
How Bandwidth and Speed Work Together
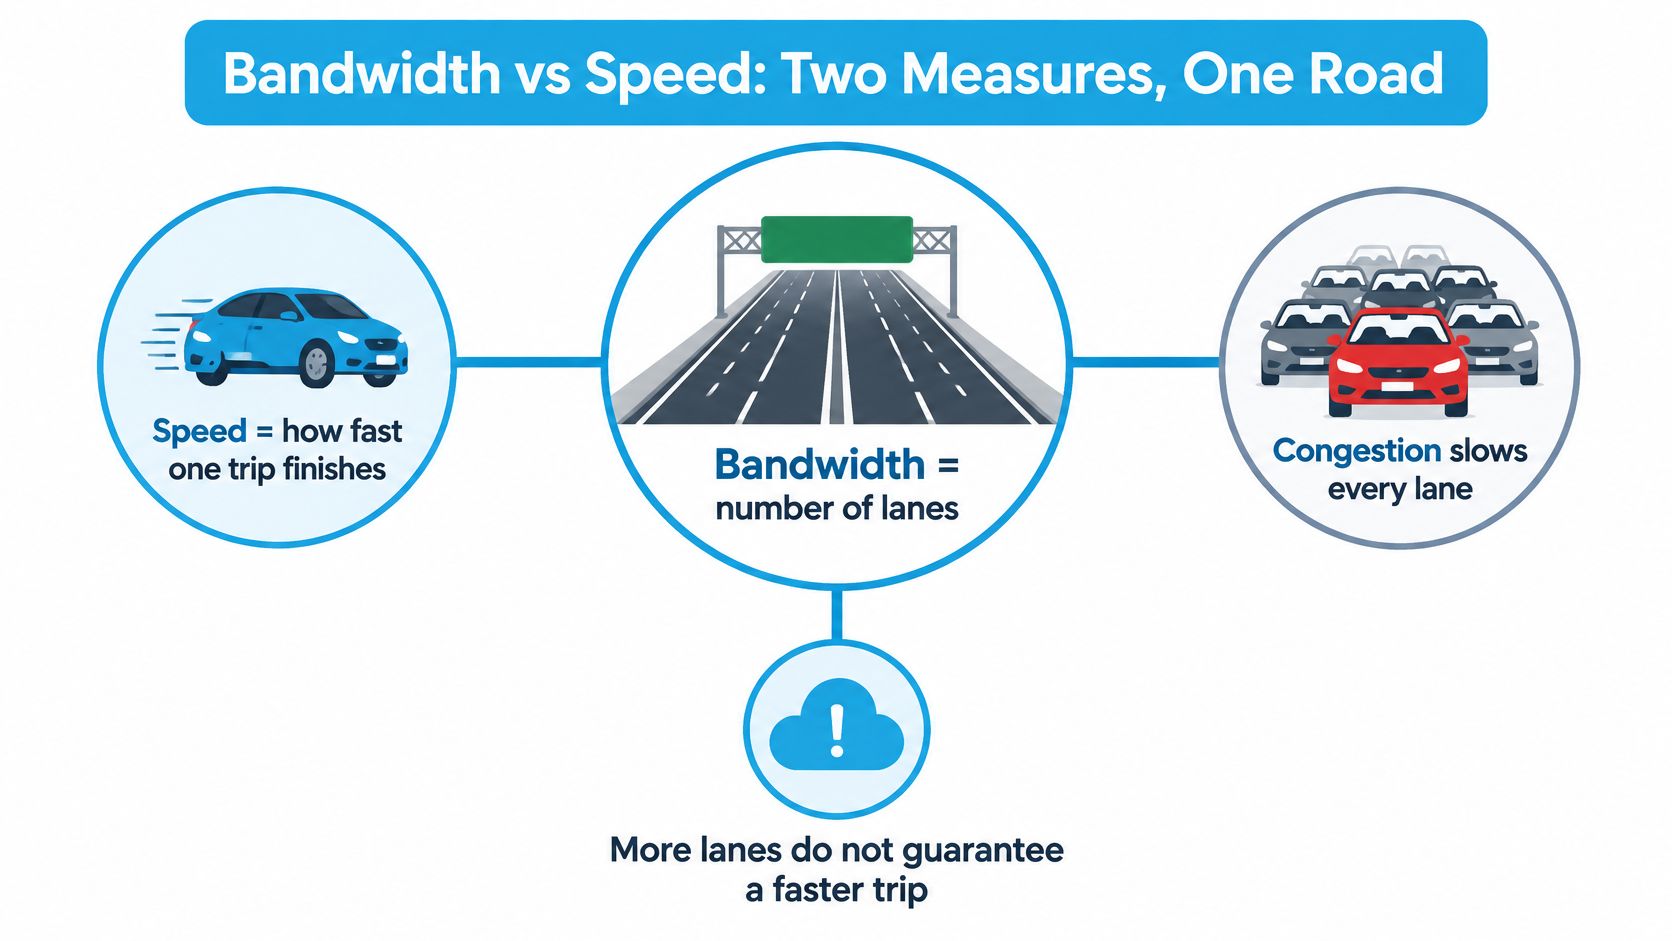
Picture a highway. Bandwidth is the number of lanes. Speed is how quickly any single car finishes the trip. Latency is the wait before the first car even moves.
Widen the road and more cars fit on it at once. You haven't made one car faster, and if the on-ramp is jammed, traffic still crawls. The U.S. National Telecommunications and Information Administration uses the same image, comparing bandwidth to the size of a transmission medium: larger capacity lets more data move simultaneously without guaranteeing that any individual packet arrives quickly, as the FCC's broadband labels glossary sets out. That's the relationship in one line. Capacity buys concurrency. Speed is what a single flow experiences.
Four limits that survive a bigger plan
On a shared rural or RV connection, four things can turn a 200 Mbps plan into a frustrating evening:
- Congestion on the tower or neighborhood node, which grows as more subscribers in range start streaming at once.
- Weak signal from distance or antenna placement, which cuts throughput before traffic even reaches the crowded part of the network.
- An overloaded router, especially an older unit that struggles with a dozen connected devices.
- High latency, the round-trip delay the FCC measures in milliseconds and that everyone else calls lag.
Throughput, meaning the rate one user gets, is not the same as the size of the pipe and not the same as the number of people sharing it.
One household, one plan, three outcomes
Say a family on a 100 Mbps plan settles in for the evening. One person starts a movie, a second joins a video call, and a cloud folder begins syncing photos. On paper the tier has room for all three. Then the signal drops a bar, the sync saturates the uplink, and the call stutters while the movie buffers. Nothing was wrong with the plan's download figure. The path was shared, the upstream direction was busy, and the delay grew.
More bandwidth lets more streams run side by side. Higher speed shortens one large transfer. Neither rescues a call when response time stretches.
The historical trend makes the same point. The FCC's February 2013 Measuring Broadband America report cited an ITU projection that average global broadband speed would rise fourfold between 2010 and 2015, from 7 Mbps to 28 Mbps. Those figures describe the throughput users could experience, not the total capacity of the networks carrying it.
Capacity, throughput and responsiveness are three different questions. A plan can win the first and lose the third.
Latency, Jitter and Loaded Speed Explained
Two connections both test at 100 Mbps this afternoon. One adds 20 ms of delay when the line fills up. The other adds 300 ms. On a spreadsheet they're identical. On a video call, the first feels normal and the second turns you into the person who talks over everybody.
The FCC tracks a metric called latency under load, also described as working latency, which it measures while the connection is saturated. Its own reporting notes those results are expected to exceed idle-latency results, and that gap is exactly where two identically rated connections diverge, as the Measuring Fixed Broadband report documents.
Ookla doesn't rank networks on download alone for the same reason. Its published scoring weights download speed at 70 percent, upload at 20 percent and latency at 10 percent, which keeps download dominant while still putting response time in the model.
Two more signals belong on your test sheet. Jitter is the variation in latency from one packet to the next. A steady 40 ms feels fine; a swing between 30 and 200 ms makes voice calls chop. Packet loss is the share of packets that never arrive, and even a small amount forces retransmission that shows up as a freeze or a garbled syllable.
Which metric decides your session
The split follows the application, not the household:
- Video calls, remote desktops and gaming live or die on stable loaded latency and low packet loss. Extra download capacity touches neither.
- 4K streaming and large downloads care about sustained download throughput and will tolerate a mediocre round-trip time.
- Cloud backups, live video and large file uploads depend on upstream throughput, the number plan pages tend to bury.
When you test, borrow the structure of the FCC's open broadband measurement methodology: it measures download and upload throughput over three concurrent TCP connections and records latency as round-trip time using UDP packets, then repeats the latency measurement under sustained load. You can approximate it with any speed test by running one at rest and a second while another device downloads a large file. Keep the gap between the two. If loaded latency is what's biting, this explanation of why latency runs so high on mobile connections covers the causes and the practical fixes.
A connection that adds 300 ms under load will drop a video call at 500 Mbps. Measure the loaded number before you pay for a faster tier.
Activity Benchmarks for Streaming, Calls and Gaming
Minimum download speed by activity
| Activity | Minimum download | Typical use |
|---|---|---|
| General browsing and email | 1 Mbps | Pages, messages and light apps |
| Standard-definition video | 3-4 Mbps | Older or basic streaming quality |
| HD video | 5-8 Mbps | Most streaming services at HD |
| 4K video | 25 Mbps | Ultra HD streaming |
| Standard personal video call | 1 Mbps | Casual video chat |
| HD personal video call | 1.5 Mbps | Clear family or friend calls |
| HD video teleconferencing | 6 Mbps | Work meetings with video |
| Online multiplayer gaming | 4 Mbps | Real-time online games |
The FCC's Broadband Speed Guide lists these as minimum download speeds for running one activity at a time. Read those last five words again, because that's where most households go wrong. The table is a floor for a single task, not a plan recommendation for a family or an RV with three people inside it.
Adding it up for one RV
Take a realistic evening in a motorhome. One person is on an HD video teleconference at 6 Mbps. A teenager streams HD video at 5 to 8 Mbps. Someone else plays an online multiplayer game at 4 Mbps. Total: roughly 15 to 18 Mbps of download, all needed at the same moment, before any allowance for overhead.
Now add a 4K stream at 25 Mbps and the same household crosses 40 Mbps. That number is the bandwidth the shared path has to carry simultaneously, not a peak you can smooth out over the hour. A 50 Mbps plan clears it with little room; a 25 Mbps plan doesn't.
Add 25 to 30 percent headroom on top for protocol overhead, background updates and the phone in someone's pocket. That's a planning habit, not a formal standard, but it's the difference between a plan that works on a quiet Tuesday and one that collapses when everyone is home.
IPTV is a useful stress test because picture quality changes the requirement. If you're weighing a streaming box for the RV, this guide to minimum internet speed for IPTV breaks down what each quality tier asks of the connection, and it pairs well with the bitrate math above.
The same logic applies to the streaming services themselves. Our breakdown of what internet speed streaming TV actually needs covers how many simultaneous HD streams a given tier supports in practice.
Total the activities that will run at the same time, compare that total against the plan's download tier, then check it against the loaded speed you measured earlier. If the total is close to the tier, you have no headroom and you'll feel it at peak hour.
Upload Speed and Latency for Remote Work
The most common advice for a bad connection is to buy a bigger download tier. For anyone whose work pushes data outward, that's often the wrong purchase. A download test can look excellent while your camera feed, your backup job and your VPN session all compete for an upstream channel that was never sized for them.
The FCC's current fixed-broadband benchmark is 100 Mbps download and 20 Mbps upload. Yet U.S. fixed-wireless measurements published by Ookla's FWA report found that median upload speeds for all three major providers stayed below that 20 Mbps upload threshold in the third quarter of 2025. Among rural subscribers in that analysis, only 26.9% of T-Mobile fixed-wireless users and 14.7% of Verizon fixed-wireless users reached the full 100/20 benchmark.
That gap explains a specific kind of frustration. Video calls upload your camera, so an undersized uplink gives you a frozen face and a clear incoming picture. Cloud backups and photo sync saturate the upstream for minutes at a time. Live streaming needs sustained upload the whole session, not a burst.
Size the uplink by the task
Skip the single headline figure and match the number to the job:
- One video call needs a modest, steady upstream and clean latency. It fails on jitter long before it fails on raw capacity.
- A multi-camera livestream needs sustained upload at a level a single-call plan never touches.
- A cloud sync or large file upload can eat the entire uplink, which is why calls drop the moment a backup starts.
Test upload the way you work
Run the upload measurement at the same hour as your work session, once with the second device idle and once while it runs a real transfer. Compare the two. If upload collapses when anything else is using the link, you've found the bottleneck, and no download upgrade will move it.
When you're shopping for a plan that survives this, look at options built around internet plans with high upload speed rather than the largest download headline on the page.
When work fails, fix upload capacity and loaded latency before you pay for a higher download tier. A bigger downstream number does nothing for a camera feed that can't leave the house.
Why Your Connection Changes by Time and Place
Symptoms, likely causes and fixes
| Symptom | Likely cause | Fix |
|---|---|---|
| Fast at noon, slow in the evening | Shared cell capacity filling at peak hours, especially 7 p.m. to 11 p.m. | Test at the same hour twice and shift large downloads to off-peak times |
| Speed test looks fine but video calls freeze | High loaded latency or packet loss | Run a loaded latency test and pause uploads during calls |
| Good download, poor upload | Upload capacity far below download, as common on fixed-wireless plans | Measure upload separately and schedule cloud backups overnight |
| Speed changes after moving the RV a few miles | Signal quality and tower distance | Reposition the antenna or router and compare readings at each spot |
| Slow when several people are online | Router limits or too many simultaneous streams | Check router capability and count active devices |
| Slower after heavy monthly use | Provider data limit or speed reduction after a threshold | Check plan terms and monthly usage against the limit |
Find your row, then read why it happens.
Availability is not performance. A network can advertise 5G and still deliver uneven results, because the label says which technology you connected to, not how much capacity that connection has. Ookla's analysis of 5G availability makes the distinction concrete: 5G was detected in 77.8% of Indian villages during the first half of 2025, while coverage still trailed 4G by 11.1 percentage points. Spectrum, rollout stage, congestion and latency all sit between the icon on your phone and the speed you get.
Peak hours are physical, not political. The FCC names peak-time usage, specifically 7 p.m. to 11 p.m., as a routine cause of reduced performance at home, alongside an old router, an old computer, high-bandwidth applications and several household members online at once, as its guide for broadband consumers explains. A tower serving a few hundred households has to divide the same capacity among all of them, and eight in the evening is when everyone asks for it.
Volume ceilings are a separate limit. Some plans carry a data limit such as 150 GB or 250 GB, after which the provider may charge extra or reduce performance depending on the terms. For scale, the FCC notes that a standard-definition movie typically uses 1 to 2 GB while an HD movie generally uses 3 to 5 GB. That ceiling is total volume for the billing period. It isn't the Mbps rate, and confusing the two leads people to buy capacity they don't need.
One hardware note matters for RV and rural setups. SwiftNet's device switches between cellular carriers to give the best service, which a standard hotspot doesn't do, so a weak tower in one location isn't the end of the story when you move or reposition.
The testing routine behind the fixes
Run the same test at two times of day and at two parking spots or room positions. Record download, upload and latency each time, on the same device, against the same test server region. The pattern tells you which cause you're facing: evening-only slowdowns point to congestion, location-dependent changes point to signal, and slow results everywhere point to equipment or a plan that never fit.
Separate the fixes by effort. Moving the router, raising the antenna or shifting a parking spot takes a day. A plan change or a provider switch takes longer, so run the tests first and let them pick.
Choose the Connection by Your Workload
Ignore the biggest number on the plan page and start from what runs in your day.
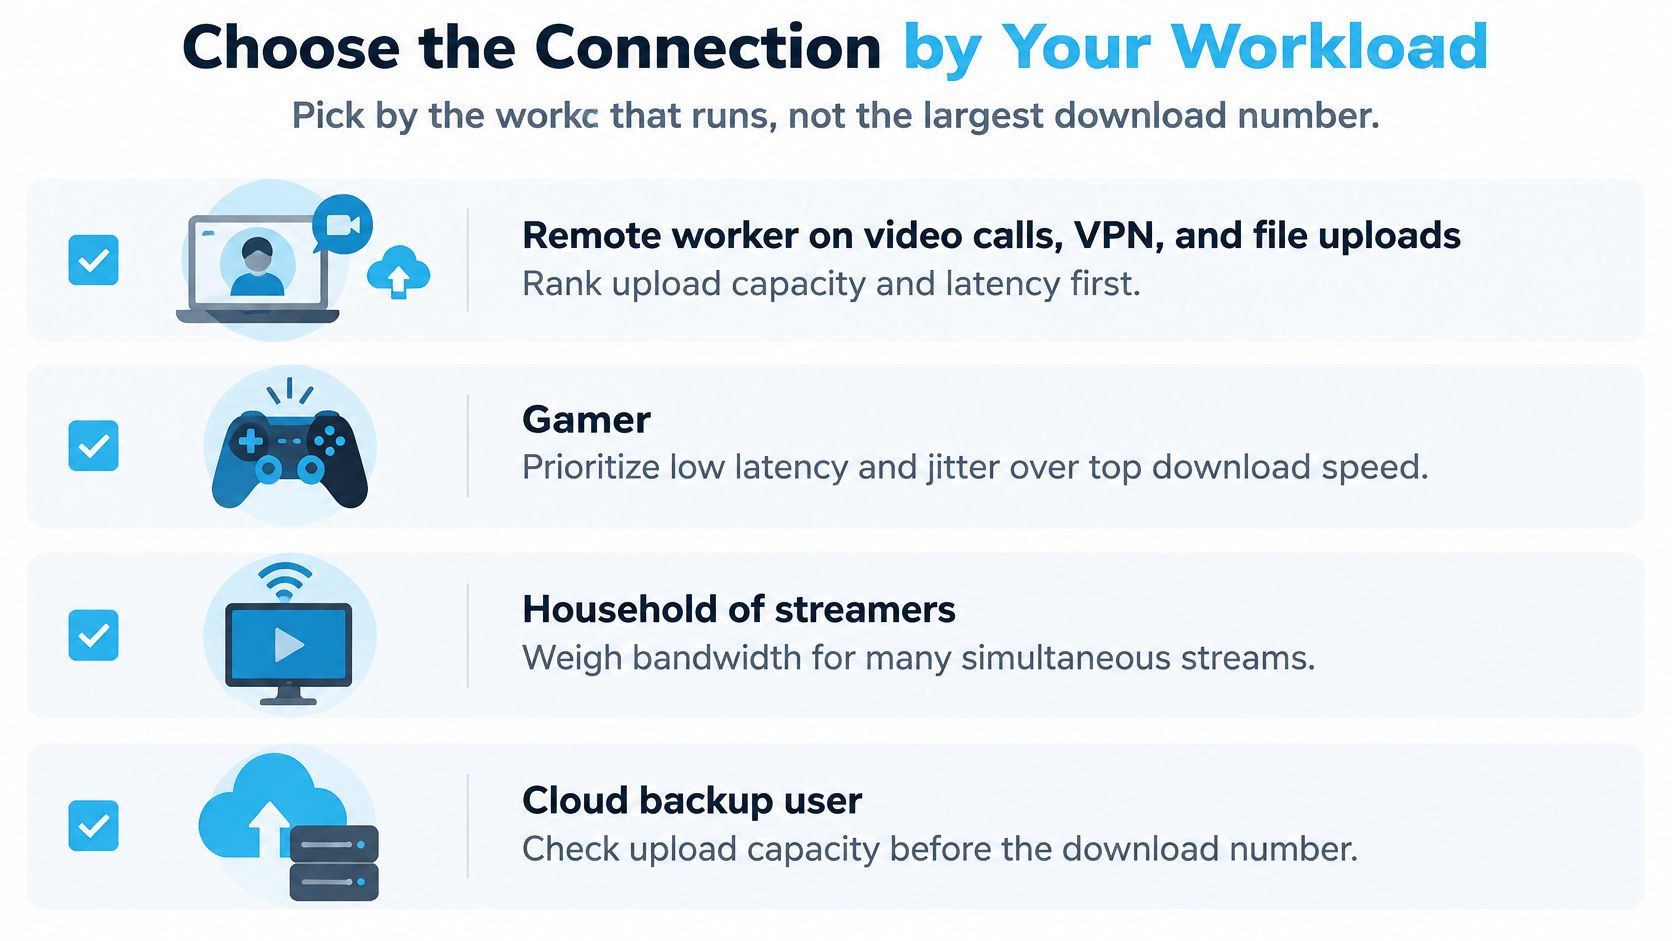
If you're a remote worker on video calls, a VPN and file uploads, rank upload capacity and loaded latency first. A higher download tier won't unfreeze a camera, and a plan with a healthy upstream and clean working latency will outrun a cheaper one with double the download and half the upload.
If you run a streaming household or a family RV with several screens, add up the simultaneous rows from the activity table, then pick a download tier that clears that total plus 25 to 30 percent. The math takes two minutes and settles arguments that otherwise run for weeks.
For the occasional traveler who browses and watches one show at a campground, a basic tier is enough, with a phone hotspot as backup for the evening the tower saturates.
A rural home on a single fixed-wireless or mobile link should measure at the address between 7 p.m. and 11 p.m., not at noon, and keep a second connection for outages. Coverage varies by street, and the FCC's mobile coverage map is the place to check what's nominal at your coordinates.
Treat every advertised maximum as a ceiling under ideal conditions, not a promised minimum. SwiftNet Wifi doesn't publish or guarantee minimum speeds, and throughput isn't guaranteed. The maximum is stated under optimal conditions and may vary significantly, and plans may carry speed limits set by the network provider. The 5G Diamond router supports speeds up to 300 Mbps on 5G and up to 100 Mbps on 4G networks, which tells you the shape of the ceiling, not what your campsite will deliver at eight in the evening.
Before you buy or switch, run one set of tests: idle and loaded download, upload and latency, at two times of day, at the desk or parking spot where you work. Total the activities that run together. Pick the tier that handles the peak total with headroom.
SwiftNet Wifi builds its 4G and 5G plans for exactly this problem: rural homes, RV travelers and remote workers who need upload capacity and steady latency, not just a large download headline. Our devices connect through AT&T, Verizon and T-Mobile and switch between carriers to hold the best service available where you're parked. Check the SwiftNet Wifi plans and run your own loaded test during the 7-day risk-free trial, then decide with numbers instead of a plan page.
#rv #rvlife #rvliving #rvlifestyle #rvrenovation #rvremodel #rvtravel #rvcamping #rvadventures #ruralwifi #5gwifi #5ginternet
Search for advice on a slow connection and nearly every page tells you the same thing: buy more download speed. Move up a tier, double the number on the plan page, and the frozen video call will sort itself out. It won't, and anyone who works from a campground or a farmhouse already knows it.
Download speed is one of four numbers that decide whether a connection works for you. The other three are bandwidth, upload capacity and loaded latency, and the last two are the ones that break remote work while a speed test still shows a healthy result.
Getting the difference straight is what lets you stop guessing. Once you can separate what a connection can carry from how fast one thing arrives, the fixes become obvious: fewer simultaneous tasks, a better antenna position, an upload test at eight in the evening, or a different plan entirely. What follows builds that understanding one step at a time.
Internet Speed vs Bandwidth at a Glance
Here's the version you can hold onto. Internet speed is the rate at which data packets are successfully delivered, usually reported in megabits per second (Mbps). Bandwidth is the maximum amount of information a communications path can carry per unit of time.
The FCC's broadband glossary document spells out the first half: speed is the observed delivery rate, and a 10 Mbps connection can theoretically deliver ten times as much information as a 1 Mbps connection during the same period. Bandwidth describes the potential of the channel rather than what any single task achieves, so a link can carry a great deal of data in total and still hand it to your laptop slowly.
Both get reported in Mbps, which is where the confusion starts. Ookla's global connectivity analysis put the global median fixed-broadband download speed at 93.93 Mbps in June 2024, against 33.5 Mbps for mobile connections. Those are measurements of throughput delivered to real devices, not statements about how much each network could theoretically carry.
Internet speed and bandwidth side by side
| Criterion | Internet speed | Bandwidth |
|---|---|---|
| Core meaning | Rate at which data packets are successfully delivered | Maximum amount of information a path can carry per unit of time |
| Typical unit | Mbps (megabits per second) | Mbps or Gbps as link capacity |
| What it describes | Observed performance at a given moment | Potential carrying capacity of the path |
| Where you see it | Speed test results and plan download and upload tiers | Plan capacity, network links and shared cell or fiber capacity |
| Main limit | Congestion, signal quality and latency | Shared among all devices and users |
| Question it answers | How fast does this file or page arrive? | How many devices and streams can run at once? |
| Fix when weak | Reduce congestion, reposition the router and test loaded latency | Upgrade the tier or reduce simultaneous use |
Two mix-ups cause most of the bad decisions.
- A plan tier is not a measurement. The number on the plan page is a maximum under good conditions, while a speed test shows what reached one device in one minute of one day. Neither one guarantees the other.
- A data cap is not bandwidth. A cap limits the total volume you consume across a billing period. Bandwidth is the rate at which traffic flows right now.
Working rule: check bandwidth to know how many tasks fit at the same time, then check measured speed and latency to know how each of those tasks will actually feel.
How Bandwidth and Speed Work Together
Picture a highway. Bandwidth is the number of lanes. Speed is how quickly any single car finishes the trip. Latency is the wait before the first car even moves.
Widen the road and more cars fit on it at once. You haven't made one car faster, and if the on-ramp is jammed, traffic still crawls. The U.S. National Telecommunications and Information Administration uses the same image, comparing bandwidth to the size of a transmission medium: larger capacity lets more data move simultaneously without guaranteeing that any individual packet arrives quickly, as the FCC's broadband labels glossary sets out. That's the relationship in one line. Capacity buys concurrency. Speed is what a single flow experiences.
Four limits that survive a bigger plan
On a shared rural or RV connection, four things can turn a 200 Mbps plan into a frustrating evening:
- Congestion on the tower or neighborhood node, which grows as more subscribers in range start streaming at once.
- Weak signal from distance or antenna placement, which cuts throughput before traffic even reaches the crowded part of the network.
- An overloaded router, especially an older unit that struggles with a dozen connected devices.
- High latency, the round-trip delay the FCC measures in milliseconds and that everyone else calls lag.
Throughput, meaning the rate one user gets, is not the same as the size of the pipe or the number of people sharing it.
One household, one plan, three outcomes
Say a family on a 100 Mbps plan settles in for the evening. One person starts a movie, a second joins a video call, and a cloud folder begins syncing photos. On paper the tier has room for all three. Then the signal drops a bar, the sync saturates the uplink, and the call stutters while the movie buffers. Nothing was wrong with the plan's download figure. The path was shared, the upstream direction was busy, and the delay grew.
More bandwidth lets more streams run side by side. Higher speed shortens one large transfer. Neither rescues a call when response time stretches.
The historical trend makes the same point. The FCC's February 2013 Measuring Broadband America report cited an ITU projection that average global broadband speed would rise fourfold between 2010 and 2015, from 7 Mbps to 28 Mbps. Those figures describe the throughput users could experience, not the total capacity of the networks carrying it.
Capacity, throughput and responsiveness are three different questions. A plan can win the first and lose the third.
Latency, Jitter and Loaded Speed Explained
Two connections both test at 100 Mbps this afternoon. One adds 20 ms of delay when the line fills up. The other adds 300 ms. On a spreadsheet they're identical. On a video call, the first feels normal and the second turns you into the person who talks over everybody.
The FCC tracks a metric called latency under load, also described as working latency, which it measures while the connection is saturated. Its own reporting notes those results are expected to exceed idle-latency results, and that gap is exactly where two identically rated connections diverge, as the Measuring Fixed Broadband report documents.
Ookla doesn't rank networks on download alone for the same reason. Its published scoring weights download speed at 70 percent, upload at 20 percent and latency at 10 percent, which keeps download dominant while still putting response time in the model.
Two more signals belong on your test sheet. Jitter is the variation in latency from one packet to the next. A steady 40 ms feels fine; a swing between 30 and 200 ms makes voice calls chop. Packet loss is the share of packets that never arrive, and even a small amount forces retransmission that shows up as a freeze or a garbled syllable.
Which metric decides your session
The split follows the application, not the household:
- Video calls, remote desktops and gaming live or die on stable loaded latency and low packet loss. Extra download capacity touches neither.
- 4K streaming and large downloads care about sustained download throughput and will tolerate a mediocre round-trip time.
- Cloud backups, live video and large file uploads depend on upstream throughput, the number plan pages tend to bury.
When you test, borrow the structure of the FCC's open broadband measurement methodology: it measures download and upload throughput over three concurrent TCP connections and records latency as round-trip time using UDP packets, then repeats the latency measurement under sustained load. You can approximate it with any speed test by running one at rest and a second while another device downloads a large file. Keep the gap between the two. If loaded latency is what's biting, this explanation of why latency runs so high on mobile connections covers the causes and the practical fixes.
A connection that adds 300 ms under load will drop a video call at 500 Mbps. Measure the loaded number before you pay for a faster tier.
Activity Benchmarks for Streaming, Calls and Gaming
Minimum download speed by activity
| Activity | Minimum download | Typical use |
|---|---|---|
| General browsing and email | 1 Mbps | Pages, messages and light apps |
| Standard-definition video | 3-4 Mbps | Older or basic streaming quality |
| HD video | 5-8 Mbps | Most streaming services at HD |
| 4K video | 25 Mbps | Ultra HD streaming |
| Standard personal video call | 1 Mbps | Casual video chat |
| HD personal video call | 1.5 Mbps | Clear family or friend calls |
| HD video teleconferencing | 6 Mbps | Work meetings with video |
| Online multiplayer gaming | 4 Mbps | Real-time online games |
The FCC's Broadband Speed Guide lists these as minimum download speeds for running one activity at a time. Read those last five words again, because that's where most households go wrong. The table is a floor for a single task, not a plan recommendation for a family or an RV with three people inside it.
Adding it up for one RV
Take a realistic evening in a motorhome. One person is on an HD video teleconference at 6 Mbps. A teenager streams HD video at 5 to 8 Mbps. Someone else plays an online multiplayer game at 4 Mbps. Total: roughly 15 to 18 Mbps of download, all needed at the same moment, before any allowance for overhead.
Now add a 4K stream at 25 Mbps and the same household crosses 40 Mbps. That number is the bandwidth the shared path has to carry simultaneously, not a peak you can smooth out over the hour. A 50 Mbps plan clears it with little room; a 25 Mbps plan doesn't.
Add 25 to 30 percent headroom on top for protocol overhead, background updates and the phone in someone's pocket. That's a planning habit, not a formal standard, but it's the difference between a plan that works on a quiet Tuesday and one that collapses when everyone is home.
IPTV is a useful stress test because picture quality changes the requirement. If you're weighing a streaming box for the RV, this guide to minimum internet speed for IPTV breaks down what each quality tier asks of the connection, and it pairs well with the bitrate math above.
The same logic applies to the streaming services themselves. Our breakdown of what internet speed streaming TV actually needs covers how many simultaneous HD streams a given tier supports in practice.
Total the activities that will run at the same time, compare that total against the plan's download tier, then check it against the loaded speed you measured earlier. If the total is close to the tier, you have no headroom and you'll feel it at peak hour.
Upload Speed and Latency for Remote Work
The most common advice for a bad connection is to buy a bigger download tier. For anyone whose work pushes data outward, that's often the wrong purchase. A download test can look excellent while your camera feed, your backup job and your VPN session all compete for an upstream channel that was never sized for them.
The FCC's current fixed-broadband benchmark is 100 Mbps download and 20 Mbps upload. Yet U.S. fixed-wireless measurements published by Ookla's FWA report found that median upload speeds for all three major providers stayed below that 20 Mbps upload threshold in the third quarter of 2025. Among rural subscribers in that analysis, only 26.9% of T-Mobile fixed-wireless users and 14.7% of Verizon fixed-wireless users reached the full 100/20 benchmark.
That gap explains a specific kind of frustration. Video calls upload your camera, so an undersized uplink gives you a frozen face and a clear incoming picture. Cloud backups and photo sync saturate the upstream for minutes at a time. Live streaming needs sustained upload the whole session, not a burst.
Size the uplink by the task
Skip the single headline figure and match the number to the job:
- One video call needs a modest, steady upstream and clean latency. It fails on jitter long before it fails on raw capacity.
- A multi-camera livestream needs sustained upload at a level a single-call plan never touches.
- A cloud sync or large file upload can eat the entire uplink, which is why calls drop the moment a backup starts.
Test upload the way you work
Run the upload measurement at the same hour as your work session, once with the second device idle and once while it runs a real transfer. Compare the two. If upload collapses when anything else is using the link, you've found the bottleneck, and no download upgrade will move it.
When you're shopping for a plan that survives this, look at options built around internet plans with high upload speed rather than the largest download headline on the page.
When work fails, fix upload capacity and loaded latency before you pay for a higher download tier. A bigger downstream number does nothing for a camera feed that can't leave the house.
Why Your Connection Changes by Time and Place
Symptoms, likely causes and fixes
| Symptom | Likely cause | Fix |
|---|---|---|
| Fast at noon, slow in the evening | Shared cell capacity filling at peak hours, especially 7 p.m. to 11 p.m. | Test at the same hour twice and shift large downloads to off-peak times |
| Speed test looks fine but video calls freeze | High loaded latency or packet loss | Run a loaded latency test and pause uploads during calls |
| Good download, poor upload | Upload capacity far below download, as common on fixed-wireless plans | Measure upload separately and schedule cloud backups overnight |
| Speed changes after moving the RV a few miles | Signal quality and tower distance | Reposition the antenna or router and compare readings at each spot |
| Slow when several people are online | Router limits or too many simultaneous streams | Check router capability and count active devices |
| Slower after heavy monthly use | Provider data limit or speed reduction after a threshold | Check plan terms and monthly usage against the limit |
Find your row, then read why it happens.
Availability is not performance. A network can advertise 5G and still deliver uneven results, because the label says which technology you connected to, not how much capacity that connection has. Ookla's analysis of 5G availability makes the distinction concrete: 5G was detected in 77.8% of Indian villages during the first half of 2025, while coverage still trailed 4G by 11.1 percentage points. Spectrum, rollout stage, congestion and latency all sit between the icon on your phone and the speed you get.
Peak hours are physical, not political. The FCC names peak-time usage, specifically 7 p.m. to 11 p.m., as a routine cause of reduced performance at home, alongside an old router, an old computer, high-bandwidth applications and several household members online at once, as its guide for broadband consumers explains. A tower serving a few hundred households has to divide the same capacity among all of them, and eight in the evening is when everyone asks for it.
Volume ceilings are a separate limit. Some plans carry a data limit such as 150 GB or 250 GB, after which the provider may charge extra or reduce performance depending on the terms. For scale, the FCC notes that a standard-definition movie typically uses 1 to 2 GB while an HD movie generally uses 3 to 5 GB. That ceiling is total volume for the billing period. It isn't the Mbps rate, and confusing the two leads people to buy capacity they don't need.
One hardware note matters for RV and rural setups. SwiftNet's device switches between cellular carriers to give the best service, which a standard hotspot doesn't do, so a weak tower in one location isn't the end of the story when you move or reposition.
The testing routine behind the fixes
Run the same test at two times of day and at two parking spots or room positions. Record download, upload and latency each time, on the same device, against the same test server region. The pattern tells you which cause you're facing: evening-only slowdowns point to congestion, location-dependent changes point to signal, and slow results everywhere point to equipment or a plan that never fit.
Separate the fixes by effort. Moving the router, raising the antenna or shifting a parking spot takes a day. A plan change or a provider switch takes longer, so run the tests first and let them pick.
Choose the Connection by Your Workload
Ignore the biggest number on the plan page and start from what runs in your day.
If you're a remote worker on video calls, a VPN and file uploads, rank upload capacity and loaded latency first. A higher download tier won't unfreeze a camera, and a plan with a healthy upstream and clean working latency will outrun a cheaper one with double the download and half the upload.
If you run a streaming household or a family RV with several screens, add up the simultaneous rows from the activity table, then pick a download tier that clears that total plus 25 to 30 percent. The math takes two minutes and settles arguments that otherwise run for weeks.
For the occasional traveler who browses and watches one show at a campground, a basic tier is enough, with a phone hotspot as backup for the evening the tower saturates.
A rural home on a single fixed-wireless or mobile link should measure at the actual address between 7 p.m. and 11 p.m., not at noon, and keep a second connection for outages. Coverage varies by street, and the FCC's mobile coverage map is the place to check what's nominal at your coordinates.
Treat every advertised maximum as a ceiling under ideal conditions, not a promised minimum. SwiftNet Wifi doesn't publish or guarantee minimum speeds, and throughput isn't guaranteed. The maximum is stated under optimal conditions and may vary significantly, and plans may carry speed limits set by the network provider. The 5G Diamond router supports speeds up to 300 Mbps on 5G and up to 100 Mbps on 4G networks, which tells you the shape of the ceiling, not what your campsite will deliver at eight in the evening.
Before you buy or switch, run one set of tests: idle and loaded download, upload and latency, at two times of day, at the desk or parking spot where you work. Total the activities that run together. Pick the tier that meets the peak total with headroom.
SwiftNet Wifi builds its 4G and 5G plans for exactly this problem: rural homes, RV travelers and remote workers who need upload capacity and steady latency, not just a large download headline. Our devices connect through AT&T, Verizon and T-Mobile and switch between carriers to hold the best service available where you're parked. Check the SwiftNet Wifi plans and run your own loaded test during the 7-day risk-free trial, then decide with numbers instead of a plan page.
Search for advice on a slow connection and nearly every page tells you the same thing: buy more download speed. Move up a tier, double the number on the plan page, and the frozen video call will sort itself out. It won't, and anyone who works from a campground or a farmhouse already knows it.
Download speed is one of four numbers that decide whether a connection works for you. The other three are bandwidth, upload capacity and loaded latency, and the last two are the ones that break remote work while a speed test still shows a healthy result.
Getting the difference straight is what lets you stop guessing. Once you can separate what a connection can carry from how fast one thing arrives, the fixes become obvious: fewer simultaneous tasks, a better antenna position, an upload test at eight in the evening, or a different plan entirely. What follows builds that understanding one step at a time.
Internet Speed vs Bandwidth at a Glance
Here's the version you can hold onto. Internet speed is the rate at which data packets are successfully delivered, usually reported in megabits per second (Mbps). Bandwidth is the maximum amount of information a communications path can carry per unit of time.
The FCC's broadband glossary document spells out the first half: speed is the observed delivery rate, and a 10 Mbps connection can theoretically deliver ten times as much information as a 1 Mbps connection during the same period. Bandwidth describes the potential of the channel rather than what any single task achieves, so a link can carry a great deal of data in total and still hand it to your laptop slowly.
Both get reported in Mbps, which is where the confusion starts. Ookla's global connectivity analysis put the global median fixed-broadband download speed at 93.93 Mbps in June 2024, against 33.5 Mbps for mobile connections. Those are measurements of throughput delivered to real devices, not statements about how much each network could theoretically carry.
Internet speed and bandwidth side by side
| Criterion | Internet speed | Bandwidth |
|---|---|---|
| Core meaning | Rate at which data packets are successfully delivered | Maximum amount of information a path can carry per unit of time |
| Typical unit | Mbps (megabits per second) | Mbps or Gbps as link capacity |
| What it describes | Observed performance at a given moment | Potential carrying capacity of the path |
| Where you see it | Speed test results and plan download and upload tiers | Plan capacity, network links and shared cell or fiber capacity |
| Main limit | Congestion, signal quality and latency | Shared among all devices and users |
| Question it answers | How fast does this file or page arrive? | How many devices and streams can run at once? |
| Fix when weak | Reduce congestion, reposition the router and test loaded latency | Upgrade the tier or reduce simultaneous use |
Two mix-ups cause most of the bad decisions.
- A plan tier is not a measurement. The number on the plan page is a maximum under good conditions, while a speed test shows what reached one device in one minute of one day. Neither one guarantees the other.
- A data cap is not bandwidth. A cap limits the total volume you consume across a billing period. Bandwidth is the rate at which traffic flows right now.
Working rule: check bandwidth to know how many tasks fit at the same time, then check measured speed and latency to know how each of those tasks will actually feel.
How Bandwidth and Speed Work Together
Picture a highway. Bandwidth is the number of lanes. Speed is how quickly any single car finishes the trip. Latency is the wait before the first car even moves.
Widen the road and more cars fit on it at once. You haven't made one car faster, and if the on-ramp is jammed, traffic still crawls. The U.S. National Telecommunications and Information Administration uses the same image, comparing bandwidth to the size of a transmission medium: larger capacity lets more data move simultaneously without guaranteeing that any individual packet arrives quickly, as the FCC's broadband labels glossary sets out. That's the relationship in one line. Capacity buys concurrency. Speed is what a single flow experiences.
Four limits that survive a bigger plan
On a shared rural or RV connection, four things can turn a 200 Mbps plan into a frustrating evening:
- Congestion on the tower or neighborhood node, which grows as more subscribers in range start streaming at once.
- Weak signal from distance or antenna placement, which cuts throughput before traffic even reaches the crowded part of the network.
- An overloaded router, especially an older unit that struggles with a dozen connected devices.
- High latency, the round-trip delay the FCC measures in milliseconds and that everyone else calls lag.
Throughput, meaning the rate one user gets, is not the same as the size of the pipe or the number of people sharing it.
One household, one plan, three outcomes
Say a family on a 100 Mbps plan settles in for the evening. One person starts a movie, a second joins a video call, and a cloud folder begins syncing photos. On paper the tier has room for all three. Then the signal drops a bar, the sync saturates the uplink, and the call stutters while the movie buffers. Nothing was wrong with the plan's download figure. The path was shared, the upstream direction was busy, and the delay grew.
More bandwidth lets more streams run side by side. Higher speed shortens one large transfer. Neither rescues a call when response time stretches.
The historical trend makes the same point. The FCC's February 2013 Measuring Broadband America report cited an ITU projection that average global broadband speed would rise fourfold between 2010 and 2015, from 7 Mbps to 28 Mbps. Those figures describe the throughput users could experience, not the total capacity of the networks carrying it.
Capacity, throughput and responsiveness are three different questions. A plan can win the first and lose the third.
Latency, Jitter and Loaded Speed Explained
Two connections both test at 100 Mbps this afternoon. One adds 20 ms of delay when the line fills up. The other adds 300 ms. On a spreadsheet they're identical. On a video call, the first feels normal and the second turns you into the person who talks over everybody.
The FCC tracks a metric called latency under load, also described as working latency, which it measures while the connection is saturated. Its own reporting notes those results are expected to exceed idle-latency results, and that gap is exactly where two identically rated connections diverge, as the Measuring Fixed Broadband report documents.
Ookla doesn't rank networks on download alone for the same reason. Its published scoring weights download speed at 70 percent, upload at 20 percent and latency at 10 percent, which keeps download dominant while still putting response time in the model.
Two more signals belong on your test sheet. Jitter is the variation in latency from one packet to the next. A steady 40 ms feels fine; a swing between 30 and 200 ms makes voice calls chop. Packet loss is the share of packets that never arrive, and even a small amount forces retransmission that shows up as a freeze or a garbled syllable.
Which metric decides your session
The split follows the application, not the household:
- Video calls, remote desktops and gaming live or die on stable loaded latency and low packet loss. Extra download capacity touches neither.
- 4K streaming and large downloads care about sustained download throughput and will tolerate a mediocre round-trip time.
- Cloud backups, live video and large file uploads depend on upstream throughput, the number plan pages tend to bury.
When you test, borrow the structure of the FCC's open broadband measurement methodology: it measures download and upload throughput over three concurrent TCP connections and records latency as round-trip time using UDP packets, then repeats the latency measurement under sustained load. You can approximate it with any speed test by running one at rest and a second while another device downloads a large file. Keep the gap between the two. If loaded latency is what's biting, this explanation of why latency runs so high on mobile connections covers the causes and the practical fixes.
A connection that adds 300 ms under load will drop a video call at 500 Mbps. Measure the loaded number before you pay for a faster tier.
Activity Benchmarks for Streaming, Calls and Gaming
Minimum download speed by activity
| Activity | Minimum download | Typical use |
|---|---|---|
| General browsing and email | 1 Mbps | Pages, messages and light apps |
| Standard-definition video | 3-4 Mbps | Older or basic streaming quality |
| HD video | 5-8 Mbps | Most streaming services at HD |
| 4K video | 25 Mbps | Ultra HD streaming |
| Standard personal video call | 1 Mbps | Casual video chat |
| HD personal video call | 1.5 Mbps | Clear family or friend calls |
| HD video teleconferencing | 6 Mbps | Work meetings with video |
| Online multiplayer gaming | 4 Mbps | Real-time online games |
The FCC's Broadband Speed Guide lists these as minimum download speeds for running one activity at a time. Read those last five words again, because that's where most households go wrong. The table is a floor for a single task, not a plan recommendation for a family or an RV with three people inside it.
Adding it up for one RV
Take a realistic evening in a motorhome. One person is on an HD video teleconference at 6 Mbps. A teenager streams HD video at 5 to 8 Mbps. Someone else plays an online multiplayer game at 4 Mbps. Total: roughly 15 to 18 Mbps of download, all needed at the same moment, before any allowance for overhead.
Now add a 4K stream at 25 Mbps and the same household crosses 40 Mbps. That number is the bandwidth the shared path has to carry simultaneously, not a peak you can smooth out over the hour. A 50 Mbps plan clears it with little room; a 25 Mbps plan doesn't.
Add 25 to 30 percent headroom on top for protocol overhead, background updates and the phone in someone's pocket. That's a planning habit, not a formal standard, but it's the difference between a plan that works on a quiet Tuesday and one that collapses when everyone is home.
IPTV is a useful stress test because picture quality changes the requirement. If you're weighing a streaming box for the RV, this guide to minimum internet speed for IPTV breaks down what each quality tier asks of the connection, and it pairs well with the bitrate math above.
The same logic applies to the streaming services themselves. Our breakdown of what internet speed streaming TV actually needs covers how many simultaneous HD streams a given tier supports in practice.
Total the activities that will run at the same time, compare that total against the plan's download tier, then check it against the loaded speed you measured earlier. If the total is close to the tier, you have no headroom and you'll feel it at peak hour.
Upload Speed and Latency for Remote Work
The most common advice for a bad connection is to buy a bigger download tier. For anyone whose work pushes data outward, that's often the wrong purchase. A download test can look excellent while your camera feed, your backup job and your VPN session all compete for an upstream channel that was never sized for them.

The FCC's current fixed-broadband benchmark is 100 Mbps download and 20 Mbps upload. Yet U.S. fixed-wireless measurements published by Ookla's FWA report found that median upload speeds for all three major providers stayed below that 20 Mbps upload threshold in the third quarter of 2025. Among rural subscribers in that analysis, only 26.9% of T-Mobile fixed-wireless users and 14.7% of Verizon fixed-wireless users reached the full 100/20 benchmark.
That gap explains a specific kind of frustration. Video calls upload your camera, so an undersized uplink gives you a frozen face and a clear incoming picture. Cloud backups and photo sync saturate the upstream for minutes at a time. Live streaming needs sustained upload the whole session, not a burst.
Size the uplink by the task
Skip the single headline figure and match the number to the job:
- One video call needs a modest, steady upstream and clean latency. It fails on jitter long before it fails on raw capacity.
- A multi-camera livestream needs sustained upload at a level a single-call plan never touches.
- A cloud sync or large file upload can eat the entire uplink, which is why calls drop the moment a backup starts.
Test upload the way you work
Run the upload measurement at the same hour as your work session, once with the second device idle and once while it runs a real transfer. Compare the two. If upload collapses when anything else is using the link, you've found the bottleneck, and no download upgrade will move it.
When you're shopping for a plan that survives this, look at options built around internet plans with high upload speed rather than the largest download headline on the page.
When work fails, fix upload capacity and loaded latency before you pay for a higher download tier. A bigger downstream number does nothing for a camera feed that can't leave the house.
Why Your Connection Changes by Time and Place
Symptoms, likely causes and fixes
| Symptom | Likely cause | Fix |
|---|---|---|
| Fast at noon, slow in the evening | Shared cell capacity filling at peak hours, especially 7 p.m. to 11 p.m. | Test at the same hour twice and shift large downloads to off-peak times |
| Speed test looks fine but video calls freeze | High loaded latency or packet loss | Run a loaded latency test and pause uploads during calls |
| Good download, poor upload | Upload capacity far below download, as common on fixed-wireless plans | Measure upload separately and schedule cloud backups overnight |
| Speed changes after moving the RV a few miles | Signal quality and tower distance | Reposition the antenna or router and compare readings at each spot |
| Slow when several people are online | Router limits or too many simultaneous streams | Check router capability and count active devices |
| Slower after heavy monthly use | Provider data limit or speed reduction after a threshold | Check plan terms and monthly usage against the limit |
Find your row, then read why it happens.
Availability is not performance. A network can advertise 5G and still deliver uneven results, because the label says which technology you connected to, not how much capacity that connection has. Ookla's analysis of 5G availability makes the distinction concrete: 5G was detected in 77.8% of Indian villages during the first half of 2025, while coverage still trailed 4G by 11.1 percentage points. Spectrum, rollout stage, congestion and latency all sit between the icon on your phone and the speed you get.
Peak hours are physical, not political. The FCC names peak-time usage, specifically 7 p.m. to 11 p.m., as a routine cause of reduced performance at home, alongside an old router, an old computer, high-bandwidth applications and several household members online at once, as its guide for broadband consumers explains. A tower serving a few hundred households has to divide the same capacity among all of them, and eight in the evening is when everyone asks for it.
Volume ceilings are a separate limit. Some plans carry a data limit such as 150 GB or 250 GB, after which the provider may charge extra or reduce performance depending on the terms. For scale, the FCC notes that a standard-definition movie typically uses 1 to 2 GB while an HD movie generally uses 3 to 5 GB. That ceiling is total volume for the billing period. It isn't the Mbps rate, and confusing the two leads people to buy capacity they don't need.
One hardware note matters for RV and rural setups. SwiftNet's device switches between cellular carriers to give the best service, which a standard hotspot doesn't do, so a weak tower in one location isn't the end of the story when you move or reposition.
The testing routine behind the fixes
Run the same test at two times of day and at two parking spots or room positions. Record download, upload and latency each time, on the same device, against the same test server region. The pattern tells you which cause you're facing: evening-only slowdowns point to congestion, location-dependent changes point to signal, and slow results everywhere point to equipment or a plan that never fit.
Separate the fixes by effort. Moving the router, raising the antenna or shifting a parking spot takes a day. A plan change or a provider switch takes longer, so run the tests first and let them pick.
Choose the Connection by Your Workload
Ignore the biggest number on the plan page and start from what runs in your day.
If you're a remote worker on video calls, a VPN and file uploads, rank upload capacity and loaded latency first. A higher download tier won't unfreeze a camera, and a plan with a healthy upstream and clean working latency will outrun a cheaper one with double the download and half the upload.
If you run a streaming household or a family RV with several screens, add up the simultaneous rows from the activity table, then pick a download tier that clears that total plus 25 to 30 percent. The math takes two minutes and settles arguments that otherwise run for weeks.
For the occasional traveler who browses and watches one show at a campground, a basic tier is enough, with a phone hotspot as backup for the evening the tower saturates.
A rural home on a single fixed-wireless or mobile link should measure at the actual address between 7 p.m. and 11 p.m., not at noon, and keep a second connection for outages. Coverage varies by street, and the FCC's mobile coverage map is the place to check what's nominal at your coordinates.
Treat every advertised maximum as a ceiling under ideal conditions, not a promised minimum. SwiftNet Wifi doesn't publish or guarantee minimum speeds, and throughput isn't guaranteed. The maximum is stated under optimal conditions and may vary significantly, and plans may carry speed limits set by the network provider. The 5G Diamond router supports speeds up to 300 Mbps on 5G and up to 100 Mbps on 4G networks, which tells you the shape of the ceiling, not what your campsite will deliver at eight in the evening.
Before you buy or switch, run one set of tests: idle and loaded download, upload and latency, at two times of day, at the desk or parking spot where you work. Total the activities that run together. Pick the tier which handles the peak total with headroom.
SwiftNet Wifi builds its 4G and 5G plans for exactly this problem: rural homes, RV travelers and remote workers who need upload capacity and steady latency, not just a large download headline. Our devices connect through AT&T, Verizon and T-Mobile and switch between carriers to hold the best service available where you're parked. Check the SwiftNet Wifi plans and run your own loaded test during the 7-day risk-free trial, then decide with numbers instead of a plan page.


