

Round-trip latency under 50 ms is excellent, 50 to 100 ms is good for most work and calls, 100 to 150 ms is usable but noticeable, and above 300 ms is poor for interactive use. Real-time gaming sits on a 100 ms round-trip budget, so a ping that feels fine for a movie can still miss the window for a match or a live call.
A speed test that shouts "fast" still leaves a question many skip. If the download number is high, why does the video call freeze the moment someone shares a screen? Download speed tells you how much data can arrive. Latency tells you how long each small exchange waits before it starts. A single ping hides which problem you have, because the same line can look quick at noon and drag at 7 p.m., or look fine on a nearby test server and lag on the meeting platform you open.
RV travelers, rural households, truck drivers, and people who work from the road feel that gap more than city fiber users. What is a good latency depends on the task, the time of day, and the server you are talking to, not on a headline speed.
Good Latency Ranges for Each Activity
Use these bands today. Under 50 ms round trip is excellent for highly interactive work. 50 to 100 ms is generally good for gaming, video calls, remote work, and responsive browsing. 100 to 150 ms may stay usable but grows noticeable. Above 300 to 400 ms is poor for most interactive broadband tasks.
Those bands track ITU-T guidance on latency and interactivity. Historical guidance treated one-way latency below 150 milliseconds as supportable for applications without a significant impact, and above 400 milliseconds as unacceptable for most broadband uses. Many consumer tests report round-trip time, so that 150 ms one-way line is roughly 300 ms round trip. Modern gaming is tighter. ITU-T guidance describes a maximum one-way latency of 50 milliseconds for online real-time gaming, which implies a two-way budget of no more than 100 milliseconds. Streaming can tolerate more delay because it buffers. Gaming, voice, video conferencing, and remote desktops need rapid two-way exchanges. Jitter, packet loss, buffering, and server distance still change how any single number feels.
How to read the activity table
Find the activity you use most. Check the good column first, then the usable column, then the point where the session is likely to feel poor. Judge your connection against that row, not against a generic "under 50 ms is always good" rule.
| Activity | Good round trip | Usable | Likely to feel poor |
|---|---|---|---|
| Competitive online gaming | Under 50 ms ideal, up to 100 ms good | 100-150 ms | Above 150 ms |
| Video calls and VoIP | Under 100 ms | 100-150 ms | Above 300 ms |
| Remote desktop and work apps | Under 100 ms | 100-150 ms | Above 300 ms |
| Browsing and cloud apps | Under 100 ms | 100-150 ms | Above 300 ms |
| Video streaming | Under 100 ms (buffering hides delay) | Up to 300 ms | Latency rarely the limit |
Competitive online gaming wants the tightest row. Shots, movement, and voice chat all wait on a round trip. Crossing 150 ms round trip is where opponents and your own inputs start to feel late.
Video calls and VoIP stay clear under 100 ms. Between 100 and 150 ms people still talk, but they start stepping on each other. Past 300 ms the pause is obvious, and people repeat themselves.
Remote desktop and work apps follow the same shape. Typing, mouse moves, and file opens are tiny messages that have to come back before the next click feels natural. A guide to internet speed for remote work pairs those delay bands with the throughput a workday really needs.
Browsing and cloud apps forgive a bit more, because a page can load in chunks. They still feel sluggish once each click waits past 150 ms, and they feel broken once replies sit past 300 ms.
Video streaming is the odd row. The player fills a buffer, so a higher ping rarely stops the show. Stalls and low throughput do. If your only complaint is buffering on Netflix or YouTube, chase capacity and signal, not a perfect ping.
Practical rule: The row for the activity you use most often is the one that decides whether the connection is good enough.
Say you are preparing for a video interview from an RV park. A steady result under 100 ms round trip keeps the conversation natural. If you also want help hearing the other side clearly, AI assistance during job interviews from ParakeetAI can sit alongside a stable call, but it cannot fix a line that spikes every time the park gets busy. Test the call path, then decide.
What Latency Measures and How Ping Reads It
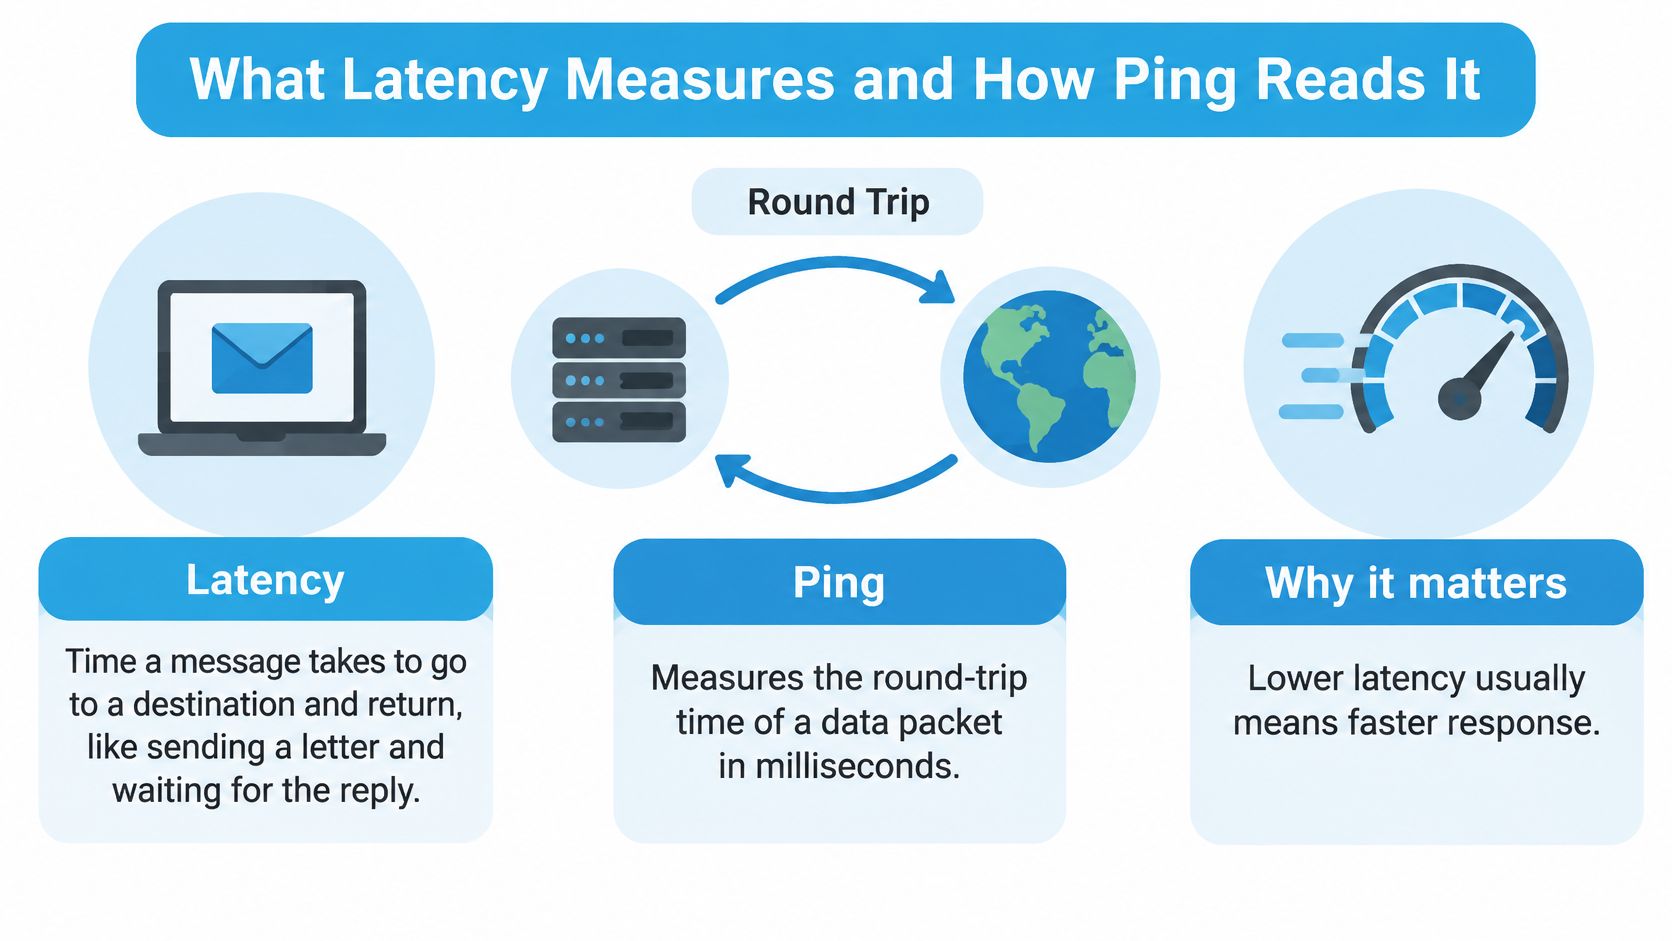
Think of latency as the time a short letter takes to reach someone and the reply takes to come back. You are not measuring how thick the envelope is. You are measuring the wait.
The FCC's Measuring Broadband America ninth report defines latency as the round-trip time for a data packet to travel from a consumer's connection to a measurement server and back. Ping is the everyday tool that sends a tiny packet and times that reply, which is why the number on your screen is almost always a round trip, reported in milliseconds.
A benchmark from fixed broadband
In that 2020 report, median fixed-broadband latencies generally ranged from 9.5 to 36 milliseconds, while Verizon DSL measured 42 milliseconds. A result under roughly 50 milliseconds sits in the range commonly seen on strong fixed networks. Around 50 to 100 milliseconds, browsing, video streaming, cloud apps, and remote work can still run, though interactive apps feel less immediate as the wait rises.
One-way latency is the trip in a single direction. People often treat it as half the round trip. It is close, but not exact, because the path out and the path back can differ. Consumer tests rarely show one-way delay at all. They show the full circle, which is the number you should compare with the activity table.
Why the test server changes the number
Latency to a nearby test server is usually lower than latency to a distant cloud service, game server, or workplace VPN. A speed-test ping of 28 ms in town does not promise 28 ms to a game host on the other coast or to a company VPN that hairpins through another state.
A low average paired with occasional spikes can still freeze a call or delay a remote desktop. Repeat the test at different times, to the service you actually open.
For rural homes, RVs, and mobile setups, speed alone is a weak scorecard. The number that matters is consistent round-trip latency to the app in front of you.
Why Jitter and Packet Loss Matter as Much as Ping
A bus that arrives every ten minutes is easy to plan around. A bus that is sometimes on time and sometimes forty minutes late is not, even if the average wait looks fine on paper. Jitter is that uneven gap. It is the variation in delay from one packet to the next.

On a call, jitter turns voices choppy and video into a freeze-frame. In a game, your character rubber-bands because some updates arrive late and then bunch up. Packet loss is worse in a different way. Those packets never arrive, so the app resends them or drops the sound. Real-time audio cannot wait for a perfect replay the way a file download can.
Ofcom's mobile benchmark defines good performance as no more than 50 ms one-way latency. That figure is not interchangeable with a round-trip ping. Half of a 90 ms ping is not automatically a pass on a one-way test, and a one-way reading is not the number most phone apps display.
Idle ping versus a loaded line
A line can show a healthy ping while you are doing nothing, then jump when someone uploads photos, runs a backup, or starts a speed test. That spike is bufferbloat. The connection's queue fills, and every new packet waits behind a pile of bulk data. Gaming and screen sharing feel it first.
The OECD points to Opensignal's broader consistent quality metric, which combines latency, jitter, packet discard, throughput, and time to first byte. Apps fail even when the headline latency looks acceptable. For remote workers and travelers on cellular, a stable 70 ms connection often beats a nominally faster one whose latency swings during uploads or downloads.
Record three companions next to ping.
- Jitter: Note the spread. A few milliseconds is calm. Large swings mean calls and games will stutter even if the average looks fine.
- Packet loss percentage: Any repeating loss on a call or match is a reason to retest, move the device, or change path. A single lost probe in a long run is less alarming than loss on every test.
- Under-load latency: Run the same ping while another device uploads or streams. That loaded number is the one your evening lives with.
Watch a short walk-through of delay, jitter, and loss if the three numbers still blur together. Then test your own line, because a diagram cannot tell you what your tower is doing at 8 p.m.
How to Measure Latency on Your Own Connection
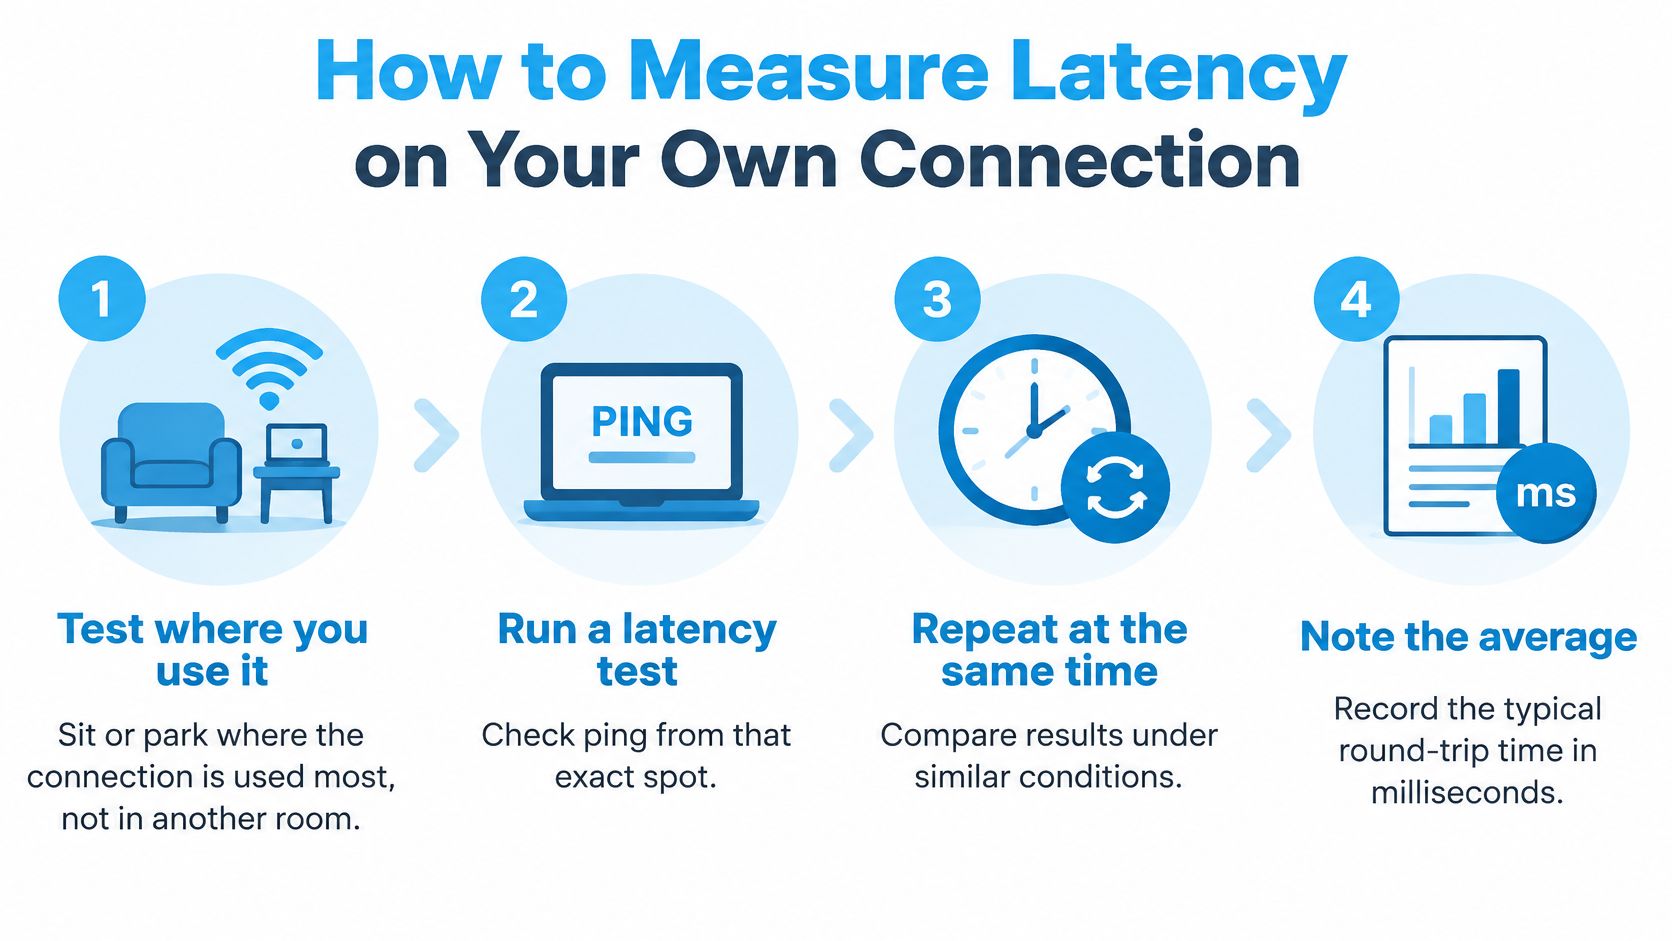
Testing where you sit or park matters more than one speed test from another room, another campsite, or the dealership Wi-Fi. Radio conditions change a few feet from a window, an awning, or a metal wall.
Six steps that show the real wait
- Sit or park where you use the connection. Use the RV spot, the truck cab, or the rural desk, not the kitchen while the router lives in the bedroom. You want the radio path you live with.
-
Ping the service you use, 20 times. On macOS or Linux that is
ping -c 20plus the game server, meeting host, or VPN address. On Windows it isping -n 20plus that same name. Twenty samples beat one lucky reply. - Repeat while another device is busy. Have a phone upload a large file or stream video. This is latency under load, and it is the test that exposes a queue.
- Run the pair again at peak evening hours, then at a quiet time. Congestion is often highest after dinner. A noon result can flatter a line that sags when the tower fills up.
- Write down the average, the spread, and the loss. The gap between the fastest and slowest replies is a rough jitter check. The summary line shows packet loss. Keep the sheet. Memory rounds the bad samples away.
- Check the 95th percentile against 100 ms. For U.S. broadband performance programs, the FCC low-latency standard used by USAC counts round-trip latency of 100 milliseconds or less for at least 95% of tested measurements. The best ping does not count. At least 95 out of 100 observations have to meet the bar. Sort your samples and see whether the slow tail still clears 100 ms.
One beautiful sample misleads because spikes are what freeze calls. If the loaded tail fails, move the hotspot or router, try a wired link to the computer, and compare another carrier from the same spot before you blame the laptop.
Keep the connection when the under-load 95th percentile meets the row for your main activity. If competitive gaming is that activity, you want the tail inside the gaming row, not merely an average that looks polite at idle.
Why Rural and Mobile Latency Runs Higher
Across G20 countries in Q4 2024, OECD analysis of Ookla data found rural users at an average latency of 28.6 ms versus 13.3 ms in cities, a gap of about 15 ms. In 13 partner economies, rural latency was at least 10 ms higher. Mobile is improving at the same time. Median mobile-network latency across OECD countries moved from 34.2 ms in Q4 2019 to 28.1 ms in Q4 2024. Rural users still sit on the slower side of that improvement.
Benchmarks by place and carrier
Read the table as a set of medians, not a promise for your driveway. Ookla's 2024 U.S. Speedtest Connectivity Report put Verizon's 5G median at 57 milliseconds and T-Mobile's median at 64 milliseconds to key gaming-server locations in the first half of 2024. Verizon's figure was 7 ms lower on that route. Your own destination can flip the order.
| Benchmark | Reported value | Context | Reading |
|---|---|---|---|
| Rural versus city average | 28.6 ms rural vs 13.3 ms city (Q4 2024) | G20 countries, Ookla data | About 15 ms gap |
| OECD median mobile latency | 28.1 ms (Q4 2024), down from 34.2 ms (Q4 2019) | OECD countries, Ookla data | Mobile is improving |
| Verizon 5G, gaming-server median | 57 ms (H1 2024) | Ookla U.S. Speedtest Connectivity Report | Carrier results vary by destination |
| T-Mobile, gaming-server median | 64 ms (H1 2024) | Ookla U.S. Speedtest Connectivity Report | Test against your own route |
Carrier choice should follow the route to your server, not a national medal. Tower distance, radio conditions, evening congestion, and routing often matter more than the label on the plan. The same carrier can feel different from one parking spot, job site, or canyon pull-off to the next. Trees, metal roofs, and a tower just over the ridge all change the radio hop before your packet ever reaches a fiber backbone.
Satellite adds another path with its own distance. If you are comparing that option with cellular, start with how the signal travels in how satellite internet works, then measure both from the spot you will use.
RV owners, truck drivers, and rural households should test at the device, during the busy evening, and while another device uploads or streams. The useful question isn't "Is my ping good?" It is whether the result stays steady enough for this task at the hour you use it.
Lowering Latency with Wired Links, Wi-Fi and QoS
Fix the hop you control before you shop for a new plan. Work down this list. The first items remove delay you add yourself.
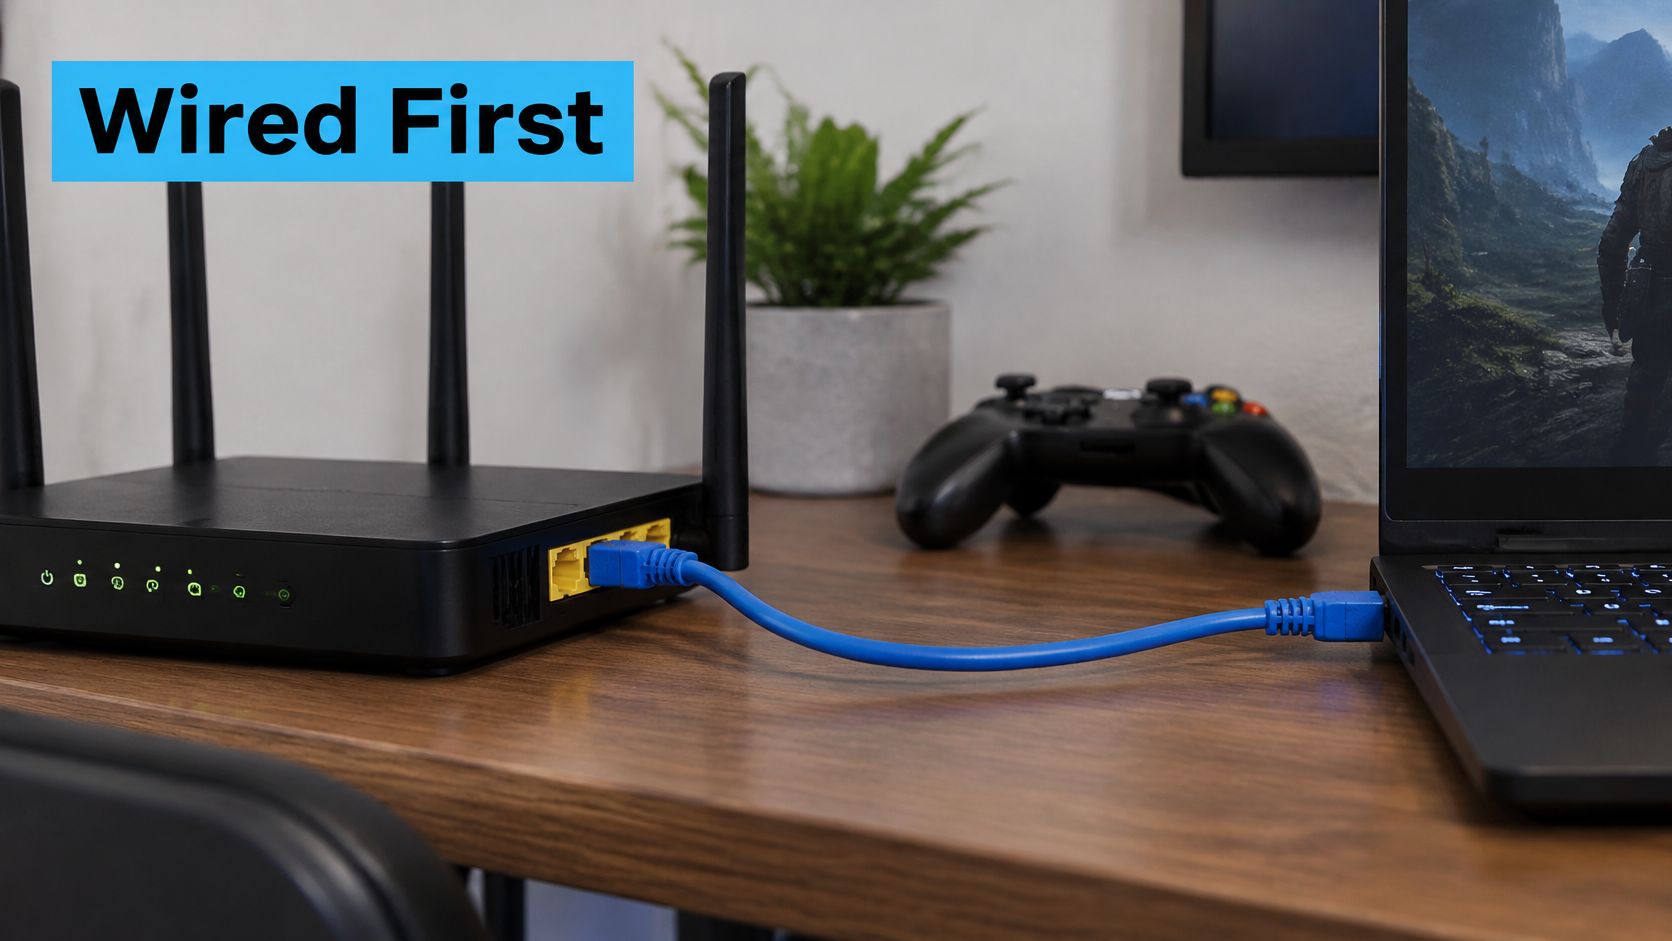
- Plug in Ethernet first. A cable from the computer or console to the router drops the Wi-Fi radio hop and the retransmissions that hop creates. If ping calms down the moment you plug in, the air was the problem.
- Use 5 GHz when you are close to the router. Place the router high and near the middle of the space, away from metal cabinets and thick walls. Distance and obstacles hurt 5 GHz faster than 2.4 GHz, so don't hide the router in a closet and expect the fast band to save you.
- Turn on QoS and favor the call or the game. Quality of service tells the router to let that device or app go first, so a cloud backup yields. QoS only helps when the bottleneck is your own network, not the carrier path or a faraway server.
- Pause bulk transfers during the session. Stop large uploads, cloud backups, software updates, and game downloads while you are on a call or in a match. Those flows are what fill the queue.
- If uploads push delay into the hundreds of milliseconds, enable smart queue management. Router menus often label it Smart Queue, Adaptive QoS, or active queue management. Cap upload below your measured upload speed, commonly around 85 percent, so the queue stays short. Ordinary priority rules miss this case because the damage happens while the uplink is full.
- Pick the closest server or meeting region. Distance sets a floor no setting can beat. A match hosted across the country will not ping like a server in your state.
- In an RV or a rural house, face the tower. Put the router or hotspot near a window on that side, and add an external antenna when the signal is weak. A few feet of placement can matter more than another speed tier.
Addressing can affect how cleanly devices reach each other on a home network. IPv6 addressing and NAT differences from Purple is a clear walk-through if you are deciding whether a double layer of address translation is in the path. It won't lower a tower's delay, but it explains some odd local behavior after you have already wired the important device.
Match the first fix to the test you already ran. Wire the client if Wi-Fi is the spike. Turn on queue control if uploads cause the lag. Change server or region if one destination is always slow and everything else is calm. A fuller pass at each of these moves is in how to reduce latency.
Confirm Your Latency Before You Commit to a Connection
Compare your sheet with the row for your main activity. If the 95th percentile under load is at or below 100 ms for gaming or work, and jitter stays low enough that voices stay clear, the connection fits that job. If it doesn't, go back through the fixes or try a different path from the same spot.
Speed is not the same thing as a low wait. SwiftNet doesn't offer, disclose, or guarantee minimum speeds, and throughput speeds aren't guaranteed, so confirm latency with your own tests instead of an advertised rate. A 7-day risk-free trial lets you run those tests at your RV, home, or worksite before you commit, and support is available by phone 24/7 at (310) 362-5308.
Run the six-step test across a week, at busy hours and quiet ones, write down the average, the tail, the jitter, and the loss, and then decide.
SwiftNet Wifi delivers 4G and 5G home and mobile internet for rural households, RV travelers, and people who work from the road, using major nationwide carriers so you can check real round-trip latency where you park or live. Plans are built for calls, remote work, gaming, and streaming, with a risk-free trial and support when a line needs another look. Visit SwiftNet Wifi and test the connection against the activity you care about before you commit.


